Context & Project Overview
As global enterprises face increasing pressure to meet sustainability targets, monitoring the environmental impact of their digital infrastructure has become a critical business requirement. Previously, users had to leave the primary cloud administration environment in the Azure portal to access environmental data through disconnected, high-level dashboards in Power BI that lacked the detail needed for day-to-day decision-making.
As the lead designer for this initiative, I spearheaded the integration of a granular carbon emissions feature directly into the Azure Portal. My goal was to move beyond passive reporting toward a proactive, actionable experience that empowers IT administrators and developers to monitor, analyze, and optimize their infrastructure’s carbon footprint.
Due to the sensitivity of the company, I can't share specific aspects of my designs publicly. If you'd like to learn more about the process and this project, feel free to contact me.
User pain points
Through deep-dive stakeholder interviews and generative research with enterprise IT leaders, I identified several critical friction points in the legacy experience:
🛑 Fragmented Workflows: Users were forced to toggle between Azure portal and external Power BI tools to see environmental data, creating significant workflow friction.
🛑 Lack of Actionable Granularity: Existing tools only provided high-level summaries. Users could not see which specific resources were the primary drivers of their emissions.
🛑 High Cognitive Load (Domain Jargon): Sustainability terminology was often unfamiliar to IT professionals, leading to confusion.
🛑 Decoupled Cost & Impact Data: Users mentioned there was a clear relationship between cloud spend and carbon output, but they lacked a unified view to perform cost-benefit analyses for sustainability initiatives.
Key Deliverables
To address these challenges, I delivered an interface tailored for IT professionals and developers that enables them to monitor sustainability metrics and drive actionability by presenting them with optimization opportunities.
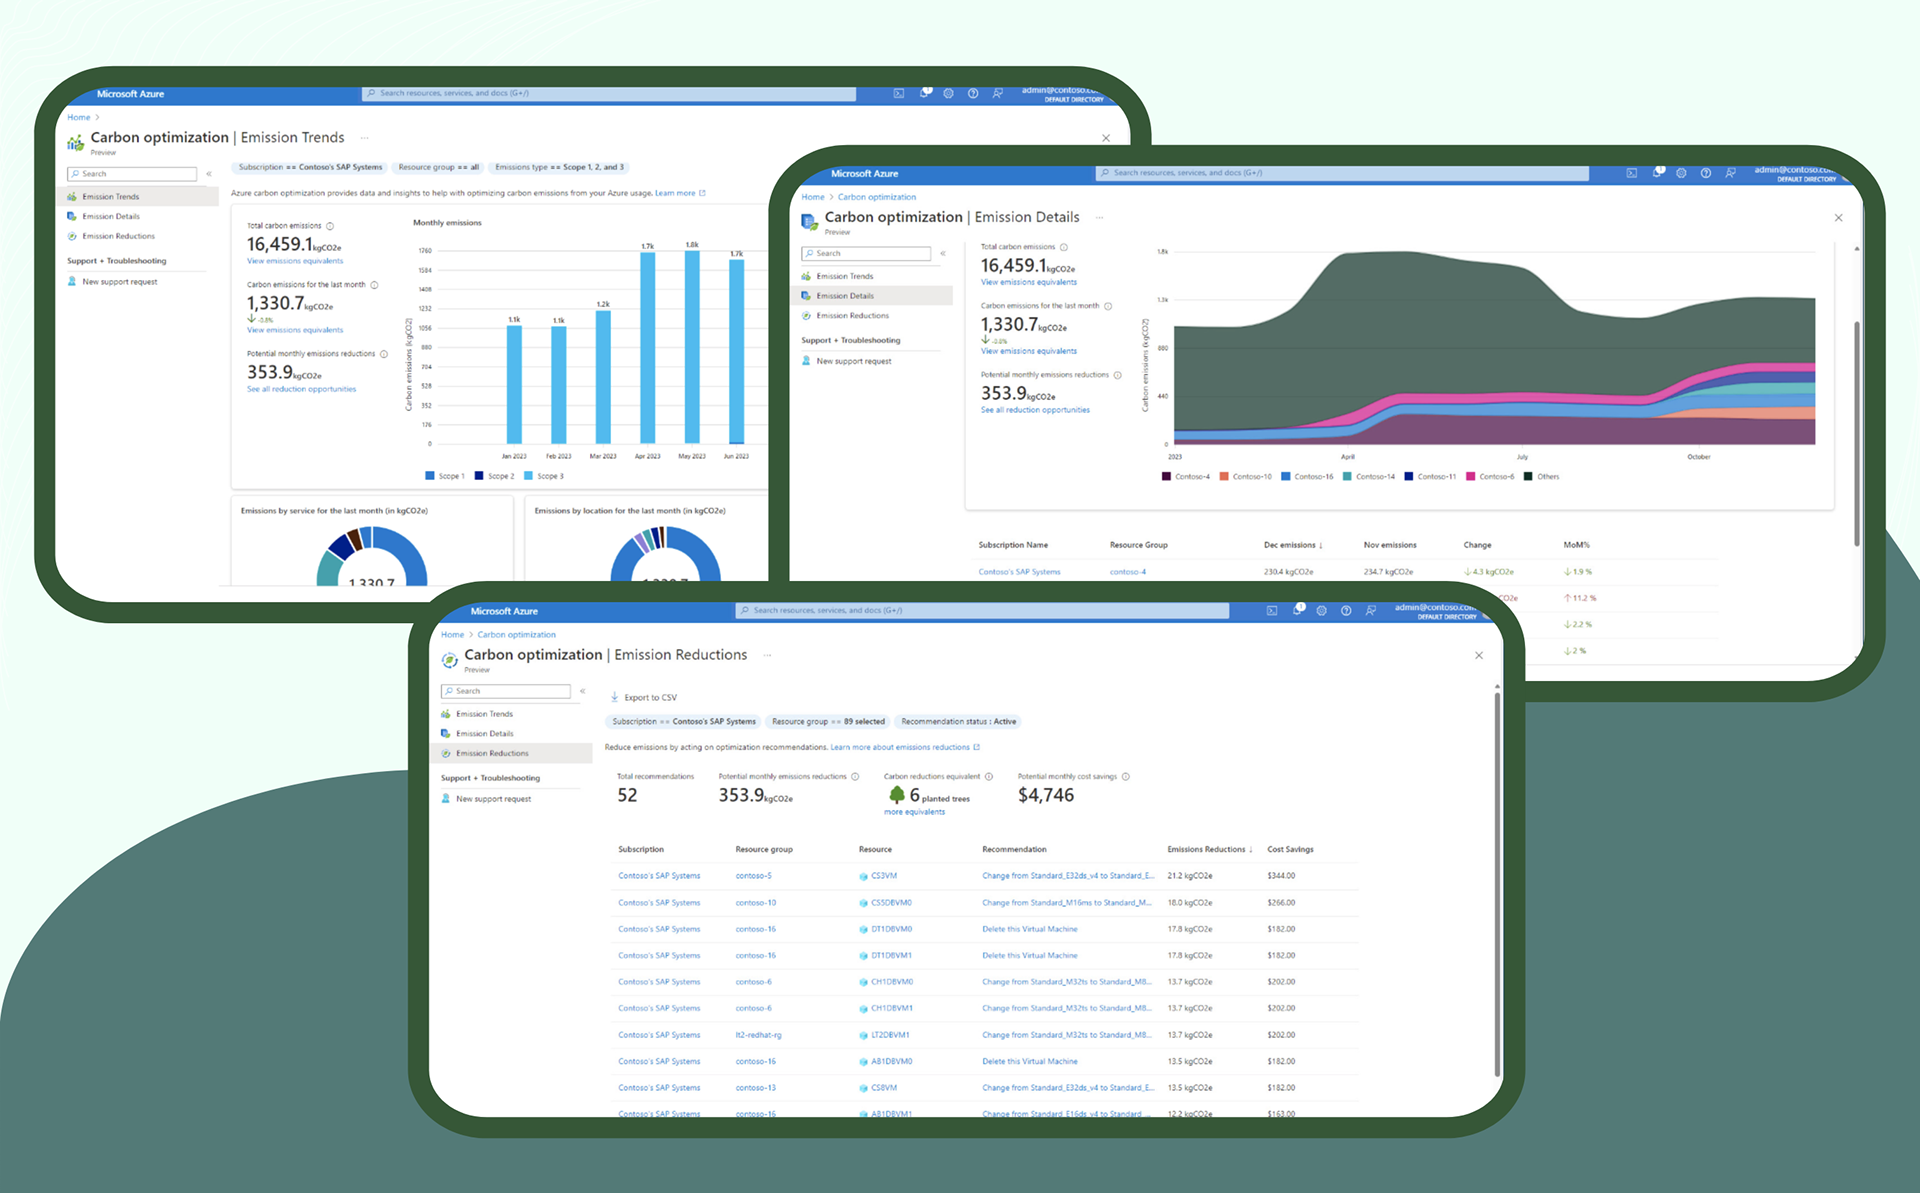
🌱 Integrated Sustainability Dashboard: A centralized dashboard within the portal that provides an immediate overview of total carbon emissions, emissions by region, and top-emitting services.
🌱 Granular Data Visualization: Designed drill-down capabilities allowing users to slice data by specific infrastructure layers, enabling them to identify and remediate "hot spots" at the resource level.
🌱 Automated Optimization Insights: A recommendations view that proactively identifies underutilized resources and suggests optimizations to reduce both carbon footprint and operational costs.
Design Impact
The redesign successfully shifted Azure portal’s environmental value proposition from passive reporting to active infrastructure management:
✅ Secured Stakeholder Buy-In: By socializing research early and presenting evidence-based low-fidelity concepts, I successfully aligned cross-organizational teams (PM, Engineering, and Sustainability expert teams) on a unified roadmap and Microsoft-wide Sustainability strategy.
✅ From "Green new isolated feature" to "Optimization Pillar": By navigating the complex tension between carbon reduction and cloud revenue, I helped reframe sustainability as a core component of the Optimization pillar. This strategic work paved the way for Azure Carbon Optimization to be integrated into the Azure Operations Center, sitting alongside Cost in the "Optimization" pillar.
✅ Democratized Accountability: We moved from a "top-down," restricted Power BI model to an empowered "subscription-owner" model. This gave the people actually managing the infrastructure: the developers and IT admins the autonomy to take ownership of their specific carbon footprint.
✅ Democratized Accountability: We moved from a "top-down," restricted Power BI model to an empowered "subscription-owner" model. This gave the people actually managing the infrastructure: the developers and IT admins the autonomy to take ownership of their specific carbon footprint.
✅ Sustained Growth & Scalability: Following General Availability (GA), the product maintained consistent month-over-month growth in active users. By embedding these insights directly into the daily workflow of the Azure Portal, we ensured that sustainability wasn't an "extra step," but a natural part of the cloud management lifecycle.
This has been one of my favorite projects over my career and I'd love to talk about it if you're interested, please contact me I'm always happy to chat!